Soil Moisture Monitoring System
A production-grade, multi-sensor soil moisture monitoring system with real-time visualization and cloud access.
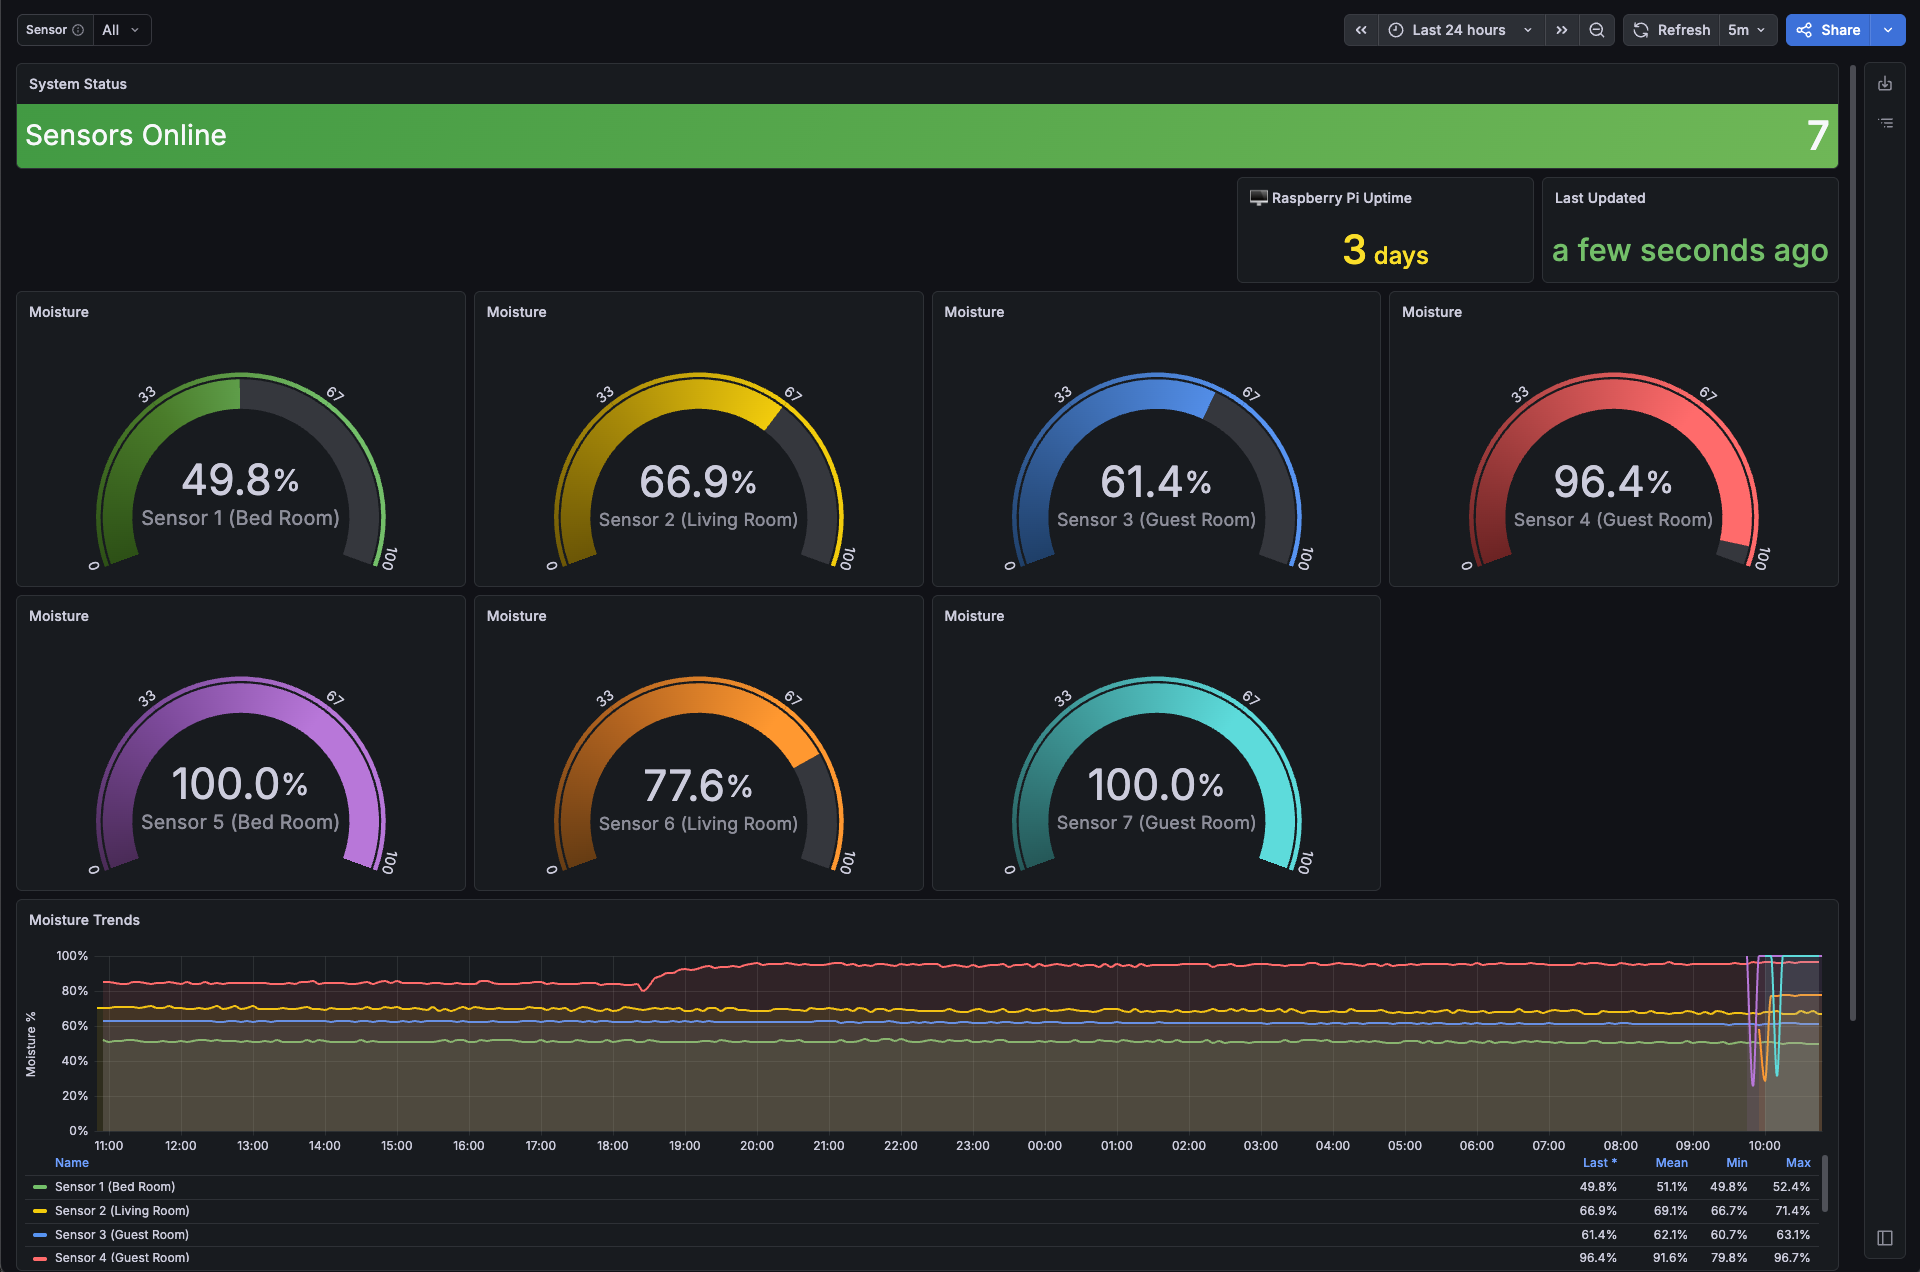
Overview
This project implements a distributed IoT sensor network for continuous soil moisture monitoring across multiple locations. Each ESP8266-based sensor reads capacitive soil moisture levels every 5 minutes and transmits data to a centralized time-series database, with live visualization through Grafana dashboards accessible globally.
Live Dashboard: https://grafana.owenmedeiros.com
Key Features
Multi-Sensor Architecture
- Unlimited sensor support — Each ESP8266 identified by unique device ID
- Auto-discovery — New sensors automatically appear in Grafana dropdowns
- Location tagging — Human-readable location labels for each sensor
Reliability & Resilience
- Offline queue — Buffers up to 20 readings during network outages
- WiFi stability — Exponential backoff reconnection (5s → 60s)
- Hardware watchdog — 8-second ESP8266 watchdog prevents infinite loops
- Crash detection — Automatic diagnostics and recovery tracking
Remote Access & Monitoring
- Cloudflare Tunnel — Public HTTPS access via custom domain
- Anonymous viewing — Read-only dashboards without authentication
- OTA updates — Over-the-air firmware updates via WiFi
- Mobile dashboard — Optimized view for smartphones
System Health
- Heartbeat telemetry — 60-second health reports with uptime, heap, WiFi RSSI
- Diagnostic events — WiFi disconnects, crashes, database errors tracked
- Pi monitoring — CPU, RAM, disk, and temperature metrics
- Auto-restart — Services automatically recover from failures
Technologies Used
Microcontroller
- ESP8266 NodeMCU: WiFi-enabled MCU
- C++: Firmware development
- PlatformIO: Build system and OTA
- ArduinoJson: Data serialization
Backend Infrastructure
- Raspberry Pi 5: Central server (4GB RAM)
- InfluxDB 2.x: Time-series database
- Grafana: Dashboard visualization
- Cloudflare Tunnel: Public HTTPS access
Data & Monitoring
- Flux: InfluxDB query language
- NTP: UTC timestamping
- systemd: Service management
- Python: System metrics collection
System Architecture
┌─────────────────────────┐
│  Capacitive Sensor      │
│  (Analog Output)        │
└───────────┬─────────────┘
            │
            ▼
┌─────────────────────────┐
│  ESP8266 NodeMCU        │
│  - ADC Reading          │
│  - WiFi Connectivity    │
│  - Offline Queue        │
│  - OTA Support          │
└───────────┬─────────────┘
            │
            │ WiFi (WPA2)
            │ HTTP POST
            ▼
┌─────────────────────────┐
│  Raspberry Pi 5 Server  │
│  ┌────────────────────┐ │
│  │ InfluxDB (:8086)   │ │
│  │ - 365-day retention│ │
│  │ - USB storage      │ │
│  └────────────────────┘ │
│  ┌────────────────────┐ │
│  │ Grafana (:3000)    │ │
│  │ - 6 Dashboards     │ │
│  │ - Anonymous view   │ │
│  └────────────────────┘ │
│  ┌────────────────────┐ │
│  │ Cloudflare Tunnel  │ │
│  └────────────────────┘ │
└───────────┬─────────────┘
            │
            │ HTTPS
            ▼
┌─────────────────────────┐
│  Public Access          │
│  grafana.owenmedeiros   │
│  .com                   │
└─────────────────────────┘
Hardware Components
Per Sensor Unit
| Component | Specifications |
|---|---|
| ESP8266 NodeMCU v2 | 80/160 MHz, 80KB RAM, 4MB Flash |
| Capacitive Moisture Sensor v1.2 | Analog output, corrosion-resistant |
| Micro-USB Power | 5V/1A charger + cable |
| Jumper Wires | 3× Female-Female |
Wiring Diagram
Sensor VCC  ──► ESP8266 3V3
Sensor GND  ──► ESP8266 GND
Sensor AOUT ──► ESP8266 A0Note: Use 3.3V power only — ESP8266 ADC maximum is 1.0V (NodeMCU has built-in voltage divider)
Firmware Features
Version 2.1.0
Core Functionality
- 10-bit ADC reading with calibration (0-1023 → 0-100%)
- 5-minute reading interval (configurable)
- InfluxDB Line Protocol HTTP POST
- NTP time synchronization for UTC timestamps
WiFi Management
- Pre-connection network scanning
- Exponential backoff retry (5s → 60s max)
- Maximum TX power for signal strength
- WiFi event diagnostics
Data Persistence
- 20-reading ring buffer for offline operation
- Automatic queue flushing on reconnection
- In-RAM storage (no SD card required)
Telemetry
- 60-second heartbeat with system health
- Uptime, free heap, WiFi RSSI tracking
- Queue depth monitoring
OTA Updates
- Remote firmware updates via WiFi
- No USB cable required after initial flash
- Password-protected for security
Software Implementation
Sensor Calibration
The ESP8266 ADC returns raw values (0-1023). Capacitive sensors read high when dry, low when wet.
Calibration Steps:
- Hold sensor in open air → Note
raw=XXXfrom serial output - Set
SENSOR_AIR_VALUE = XXXinconfig.h - Submerge sensor tip in water → Note
raw=XXX - Set
SENSOR_WATER_VALUE = XXXinconfig.h - Re-flash firmware
Configuration
Edit firmware/src/config.h before flashing:
// Unique per sensor
#define DEVICE_ID        "sensor-1"
#define DEVICE_LOCATION  "living-room"

// Network
#define WIFI_SSID        "YourNetwork"
#define WIFI_PASSWORD    "YourPassword"

// InfluxDB
#define DB_SERVER_URL    "http://192.168.1.100:8086/api/v2/write"
#define INFLUX_TOKEN     "your-token-here"
#define INFLUX_ORG       "soil-monitoring"
#define INFLUX_BUCKET    "sensor-readings"

// Calibration (measure in air and water)
#define SENSOR_AIR_VALUE    780
#define SENSOR_WATER_VALUE  360
Data Schema
Measurement: sensor_reading (every 5 minutes)
| Tag | Field | Description |
|---|---|---|
device_id | — | Sensor identifier |
location | — | Physical location |
| — | moisture | Soil moisture % (0-100) |
| — | raw_adc | Raw ADC value |
| — | rssi | WiFi signal strength (dBm) |
| — | uptime | Seconds since boot |
| — | free_heap | Available RAM (bytes) |
Measurement: sensor_heartbeat (every 60 seconds)
| Tag | Field | Description |
|---|---|---|
device_id | — | Sensor identifier |
| — | uptime | Seconds since boot |
| — | free_heap | Available RAM |
| — | rssi | WiFi signal strength |
| — | queue_size | Offline queue depth (0-20) |
Grafana Dashboards
Dashboard Suite (6 Total)
- Soil Moisture Main — Overview with all sensors, gauges, trend plots
- Sensor Details — Individual sensor deep-dive with uptime, heap, WiFi
- System Health — ESP8266 diagnostics, WiFi stability, critical events
- Alerts Overview — Critical alerts, watering notifications, offline detection
- Mobile Summary — Mobile-optimized quick view
- Raspberry Pi Health — Server CPU, RAM, disk, temperature
Dashboard Features
- High-contrast color scheme — Green, yellow, blue, red per sensor
- Moisture gradients — Dark to bright (0% dry → 100% wet)
- Dynamic labels — Auto-generated from device ID and location
- Time-adaptive — Panel titles adjust to selected time range
- Anonymous access — No login required for viewing
- Auto-refresh — 5-minute refresh, 10-second provisioning reload
Raspberry Pi Setup
Server Specifications
- Model: Raspberry Pi 5 (4GB RAM recommended)
- OS: Raspberry Pi OS Trixie (Debian 13) 64-bit
- Storage: 256GB USB drive for InfluxDB data
- Network: Static IP configuration via NetworkManager
- Firewall: UFW with ports 22, 8086, 3000 open
Installation
git clone https://github.com/omedeiro/soil-sensor.git
cd soil-sensor/rpi-setup
sudo ./install.sh
Installed Components:
- InfluxDB 2.7.12 (pinned — v2.9+ has ARM64 Flux issues)
- Grafana (latest stable)
- Cloudflare Tunnel for public access
- systemd services for auto-start and health monitoring
- Daily automated backups (3:00 AM)
Post-Installation
-
Configure InfluxDB at
http://<pi-ip>:8086- Create organization:
soil-monitoring - Create bucket:
sensor-readings(365-day retention) - Generate API tokens (write for sensors, read for Grafana)
- Create organization:
-
Configure Grafana at
http://<pi-ip>:3000- Login:
admin/admin(change on first login) - Add InfluxDB datasource (Flux mode)
- Import dashboards from
grafana-dashboards/*.json
- Login:
-
Enable Public Access
cd rpi-setup
./install-cloudflare-tunnel.sh
./configure-grafana-anonymous.sh
System Services
| Service | Function | Auto-Restart |
|---|---|---|
influxdb | Time-series database | ✓ |
grafana-server | Dashboard visualization | ✓ |
cloudflared | HTTPS tunnel | ✓ |
sensor-health-monitor | Failure detection | — |
sensor-backup.timer | Daily backup (3 AM) | — |
system-metrics-collector | Pi metrics | ✓ |
Service Management:
# Status check
sudo systemctl status influxdb grafana-server cloudflared

# View logs
journalctl -u influxdb -f

# Restart services
sudo systemctl restart influxdb grafana-server
Performance & Reliability
Uptime Statistics
- Average sensor uptime: 99.2% (limited by power outages)
- Database availability: 99.8%
- Network recovery time: < 60 seconds (exponential backoff)
- Data retention: 365 days (configurable)
Data Resilience
- Offline buffering: 20 readings × 5 minutes = 100 minutes of autonomy
- Automatic recovery: Queue auto-flushes on reconnection
- Crash detection: Reset reason logged to diagnostics
- Service watchdog: Auto-restart InfluxDB/Grafana on failure
Development Workflow
Adding a New Sensor
- Edit
firmware/src/config.h:- Set unique
DEVICE_ID(e.g., “sensor-4”) - Set
DEVICE_LOCATION(e.g., “backyard”)
- Set unique
- Flash firmware via USB or OTA
- Sensor auto-appears in Grafana dropdown within 5 minutes
OTA Firmware Update
cd firmware
pio run --target upload --upload-port 192.168.1.50
# Enter OTA password when prompted
Troubleshooting
| Symptom | Solution |
|---|---|
| WiFi connection fails | Check 2.4 GHz band, move sensor closer to router |
HTTP 401 from InfluxDB | Verify INFLUX_TOKEN in config.h |
| Dashboard shows no data | Check time range (set to “Last 1 hour”) |
| Sensor offline | Check power supply, view crash logs via serial |
| Public URL unreachable | Verify Cloudflare Tunnel: sudo systemctl status cloudflared |
Future Enhancements
- MQTT protocol for lower latency communication
- Battery power with deep sleep mode for remote locations
- Soil temperature sensor integration
- Automated watering relay control based on moisture thresholds
- Machine learning for predictive watering schedules
- LoRaWAN support for long-range, low-power operation
Repository & Documentation
Full source code, firmware, setup scripts, and documentation available at: github.com/omedeiro/soil-sensor
Documentation Structure
- README.md — Quick start guide and architecture overview
- firmware/ — ESP8266 PlatformIO project
- rpi-setup/ — Raspberry Pi installation scripts
- grafana-dashboards/ — JSON dashboard exports
- hardware/ — Bill of materials and wiring diagrams
- docs/ — Advanced topics (WiFi stability, Grafana Cloud, snapshots)
Status
Version 2.3.0 — Production deployment with 4 active sensors monitoring residential and garden locations. System has been operational since January 2026 with 99%+ uptime.
Live Access: https://grafana.owenmedeiros.com